Quantitative models offer a superior approach in determining which interventions to support. However, naive cost-effectiveness estimates have big problems. In particular:
This is an implementation of Michael Dickens' attempt to build a quantitative model for cause selection which does not have these limitations.
The model makes estimates by using expected-value calculations to produce probability distributions of utility values. It then uses these estimates as evidence to update a prior over the effectiveness of different interventions. Treating estimates as evidence updating a prior means that interventions with more robust evidence of effectiveness have better posteriors.
You can use this app to see the results of the model given various input assumptions. You can see different inputs by clicking on the tabs in the sidebar. After editing them, you can click the "Calculate" button to see how your changed inputs affect the result.
You can directly use the backend or add new models by cloning the GitHub repo.
This model is a work in progress. We cannot guarantee that it doesn't have any major errors. Let me know if you see any errors or have suggestions for how to improve it.
This version was implemented by Michael Dickens and Buck Shlegeris.
Measured in terms of QALYs per $1000.
Value of the far future: {this.output("EV of far future", "value")}
Sigma (σ) gives the standard deviation of the log base 10 of the distribution. That means σ tells you how the interventions vary in terms of orders of magnitude—so σ=1 means the standard deviation is 1 order of magnitude.
Prior distribution weights: how much relative credence should we put in each prior distribution shape?
{this.simpleScalarsTable([ ["log-normal weight",0.5], ["Pareto weight",0.5], ])}Log-normal prior parameters. We write a log-normal distribution as X = 10m Z + σ where Z is normally distributed and μ = 10m.
{this.simpleScalarsTable([ ["log-normal prior mu",0.1], ["log-normal prior sigma",0.75], ])}Pareto prior parameters. We write a Pareto distribution as (α mα) / (xα+1) where median = m * 21/α.
{this.simpleScalarsTable([ ["Pareto prior median",0.1], ["Pareto prior alpha",1.5], ])}Next establish some basic facts.
{this.simpleScalarsTable([ ["interest rate",0.05,"Rate of return on monetary investments."], ])}Let's sort out how good we think different beings' lives are, and how much they matter. "Well-being" tells us how subjectively valuable a being's experience is, and "sentience adjustment" tells us how sentient a being is relative to humans. So for example, factory farming is really bad, so well-being is below -1, meaning that life on a factory farm is more bad than normal life is good. But chickens are probably less sentient than humans so the sentience adjustment is less than 1.
{this.simpleScalarsTable([ ["wealthy human well-being", 1, "Centered around 1 by definition"], ["developing-world human well-being", 0.6, "Extremely poor people's lives are about half as good as those in the developed world according to world happiness surveys."], ["factory-farmed animal wellbeing", -10, "I would be willing to give up 10 years of normal life to avoid living one year on a factory farm."], ["factory-farmed animal sentience adjustment", 0.3, "This does not include fish/shellfish."], ["cage-free well-being improvement", 1], ["wild vertebrate well-being", -2], ["wild vertebrate sentience adjustment", 0.2], ["insect well-being", -4], ["insect sentience adjustment", 0.01], ["hedonium well-being", 100], ["hedonium brains per human brain", 1000000], ["em well-being", 2, "Basically humans but with less suffering."], ["ems per human brain", 1], ["paperclip maximizer well-being", 0.1], ["paperclip maximizers per human brain", 1], ["dolorium well-being", -100], ["dolorium brains per human brain", 1000000] ])}Room for more funding factors
{this.simpleScalarsTable([ ["GiveDirectly RFMF factor",1], ])} {this.simpleScalarsTable([ ["DtW RFMF factor",0.7], ])} {this.simpleScalarsTable([ ["AMF RFMF factor",0.8], ])}References
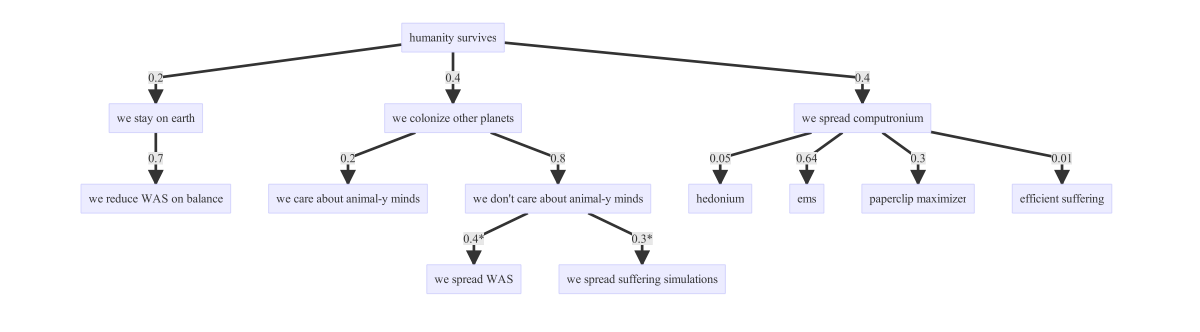
How conditionally likely are all these outcomes? (See notes for conditions, or see the image at [5].)
{this.simpleScalarsTable([ ["P(stay on earth)",0.2,"See [4] for explanation."], ["P(we reduce WAS on balance)",0.7,"Conditional on staying on earth. WAS = wild animal suffering."], ["P(fill universe with biology)",0.4,"See [4], section \"We colonize other planets, a.k.a. Biological Condition\""], ["P(society doesn't care about animals)",0.8,"conditional on filling universe with biology"], ["P(we have factory farming)",0.2,"Conditional on society doesn't care about animals"], ["P(we spread WAS)",0.4,"Conditional on society doesn't care about animals. WAS = wild animal suffering"], ["P(we make suffering simulations)",0.3,"Conditional on society doesn't care about animals"], ["P(fill universe with computers)",0.4,"See [4], section \"We spread computronium\""], ["P(hedonium)",0.05,"Conditional on filling the universe with computers. Hedonium = maximally happy beings experiencing euphoria forever."], ["P(ems)",0.3,"Conditional on filling the universe with computers. Ems = computer emulations of human-like brains."], ["P(paperclip maximizers)",0.649,"Conditional on filling the universe with computers"], ["P(dolorium)",0.001,"Conditional on filling the universe with computers. Dolorium = maximally suffering beings (opposite of hedonium)."], ])}What is the far future like?
{this.simpleDistributionsTable([ ["years of future",1e11,1e12,"[2]"], ["accessible stars by computers",1e11,1e14,"[3]"], ["usable wattage per star",1e20,1e25,"[3]"], ["brains per watt",0.1,0.1,"[3]"], ["accessible stars by biology",1e10,1e14,"[3]"], ["humans per star",1e10,1e12], ["factory farmed animals per star",1e10,1e12], ["wild vertebrates per star",1e13,1e16,"[1]; assumes 1-10 planets per star"], ["insects per star",1e17,1e21,"[1]"], ["simulations per insect",1e-3,1], ])}References
Let's try to figure out if we should advocate for people to care more about farm animals.
{this.simpleScalarsTable([ ["veg RFMF factor",1], ])} {this.simpleDistributionsTable([ ["years factory farming prevented per $1000",700,13000,"Estimated by doubling The Humane League's 80% CI from [1]. Excludes shellfish."], ["memetically relevant humans",1e9,2e9], ["vegetarians per $1000",22,323,"Estimated by doubling the 80% CI for online ads from [2]."], ["years spent being vegetarian",5,8,"[2]"], ["annual rate at which vegetarians convert new vegetarians",0.005,0.03], ])}How would animal advocacy affect far-future values?
{this.simpleDistributionsTable([ ["factory farming scenarios prevented by changing values",1,1,"Recall that this is conditional on the probabilities given in the far future tab, including P(society doesn't care about animals) and P(we spread factory farming). Without conditioning on those, this value would be a lot lower."], ["wild vertebrate suffering prevented by changing values",0.4,0.8,"As a proportion of total suffering (in expectation)."], ["insect suffering prevented by changing values",0.2,0.4], ["suffering simulations prevented by changing values",0.2,0.4], ["hedonium scenarios caused by changing values",0.01,0.1], ["dolorium scenarios prevented by changing values",0.001,0.001], ])}References
Let's talk about cage free campaigns!
{this.simpleScalarsTable([ ["cage free RFMF factor",0.7], ])} {this.simpleDistributionsTable([ ["cage-free total expenditures ($M)",2,3,"Includes all money spent on cage-free campaigns."], ["years until cage-free would have happened anyway",5,10,"[1]"], ["millions of cages prevented",100,150,"[1]"], ["proportion of change attributable to campaigns",0.7,1], ["cage-free years per cage prevented",1,1,"[2]"], ["values spreading effect of cage-free year relative to vegetarian-year",0.01,0.1,"I suspect this is fairly low because cage-free has weaker memetic effects than vegetarianism. Lewis Bollard disagrees, see comments [1]."], ])}References
General
{this.simpleScalarsTable([ ["GFI RFMF factor",0.7], ])} {this.simpleDistributionsTable([ ["factory farming years caused per human year",3,4,"Including land animals only because we have better stats on them"], ["speciesism reduction caused by not eating animals",0.05,0.15,[1]], ["GFI budget ($K)",1600,1700], ])}GFI value from accelerated cultured meat production
{this.simpleDistributionsTable([ ["number of people who'd switch to cultured meat (millions)",500,2000], ["years cultured meat accelerated by GFI per year",0.01,0.1], ])}GFI value from helping startups (excluding cultured meat companies)
{this.simpleDistributionsTable([ ["mean revenue of startups GFI supports ($K)",2000,10000], ["number of startups GFI can support per year",10,15], ["money per person-year spent on animal products",500,800,"[2]"], ["proportion of startup success attributable to GFI",0.03,0.1], ])}GFI value from corporate engagement
{this.simpleDistributionsTable([ ["millions of factory farming years displaced at restaurants and grocery stores by GFI",100,200,"Assumes this operates fairly similarly to cage-free campaigns. I didn't put much thought into this"], ])}References
For this intervention, we are going to have a mixture over two models. This gives AI Safety a bit of an unfair advantage since the calculations assume that these two models are independent, which unduly increases confidence in them. If you don't like this, you can set one of the model weights to 0.
Model weights: how much relative credence should we put in each model?
{this.simpleScalarsTable([ ["Model 1 weight",0.5], ["Model 2 weight",0.5], ["Model 3 weight",0.0], ])}General
{this.simpleScalarsTable([ ["AI safety RFMF factor",0.7], ])} {this.simpleScalarsTable([ ["cost per AI researcher",100000,"Some uncertainty here about how to account for counterfactuals; presumably AI safety researchers would do something high value otherwise"], ])} {this.simpleDistributionsTable([ ["P(AI-related extinction)",0.03,0.3,"Estimated from [3]. CI for probability represents uncertainty about the estimate."], ])}Model 1 (taken from Global Priorities Project [4])
{this.simpleDistributionsTable([ ["size of FAI community when AGI created",200,10000,"[2]"], ["AI researcher multiplicative effect",1,3,"If we add one new researcher now, there will be this many new researchers by the time AGI is developed."], ["proportion of bad scenarios averted by doubling total research",0.1,0.7], ])}Model 2
{this.simpleDistributionsTable([ ["hours to solve AI safety",1e6,1e10,"Perhaps this should follow Pareto dist? [1]"], ["hours per year per AI researcher",2000,2000], ])}Model 3
If we encounter a hard takeoff, AI safety is probably more or less binary: it either works or it doesn't. Therefore, the relevant question becomes: will we have done enough AI safety research by the time a hard takeoff occurs? And more specifically, will my donation make the difference between "we haven't done enough research" and "we've done enough research"? {this.simpleDistributionsTable([ ["P(hard takeoff)",0.3,0.7], ["P(AGI bad by default)",1,1], ["years research needed to solve AI safety",1e4,1e7], ["years research done by hard takeoff date",500,50000,"You could estimate this by guessing when AGI will occur and how much the AI safety field will grow."], ])}References
This assumes that an ACE top charity does as much good as the "veg advocacy" intervention.
Since the value of ACE directly relates to the value of top animal interventions, we don't calculate a posterior for ACE, and instead just use the posterior value for the veg advocacy intervention. Some of the inputs use ranges to give the reader a sense of how uncertain these values are, but the ranges don't actually matter in this case; all that matters is the mean estimate.
Inputs for the value of ACE money moved:
{this.simpleScalarsTable([ ["ACE RFMF factor",0.7], ])} {this.simpleScalarsTable([ ["proportion ACE money moved between effective animal charities",0.7,"In other words, how much of ACE's money moved would have gone to some other effective animal charity otherwise? Estimated from [1]."], ["proportion ACE money moved to effective animal charities",0.3,"How much of ACE's money moved would have gone to something substantially less effective, or wouldn't have been donated at all?"], ])} {this.simpleDistributionsTable([ ["ACE budget ($K)",150,300], ["ACE total money moved ($K)",1000,1500], ["ACE marginal money moved relative to total money moved",0.2,0.4], ["relative improvement between top animal charities",0.1,0.3,"That is, if ACE's top animal charity does 1 unit of good, how many fewer units of good do other effective animal charities do?"], ["relative improvement from money moved to effective animal charities",0.9,0.9], ])}Inputs for the value of ACE intervention research:
{this.simpleDistributionsTable([ ["relative improvement between animal interventions",0.2,0.5], ["money put into interventions that ACE researches ($K)",8000,12000,"According to GuideStar, MFA has a budget of $5M, Human League has $1M, Animal Equality $300K. Some other orgs have similar activities."], ["proportion of money moved by ACE report",0.002,0.02], ])}How valuable are donations to ACE relative to donations to ACE top charities, considering just the effects from ACE moving money? Let's say a $1000 donation to an ACE top charity does 1 unit of good.
References
These numbers give the historical stats for REG from its inception through the first half of 2016.
{this.simpleDistributionsTable([ ["REG budget ($K)",150,200], ["REG ratio of future money moved to historical money moved",0.5,1.2], ])}Units in thousands of dollars.
{this.simpleScalarsTable([ ["REG money raised for global poverty",439,"Uses impact estimate for AMF since REG mostly raises money for AMF"], ["REG money raised for veg advocacy",123], ["REG money raised for AI safety",263], ["REG money raised for speculative animal charities",164], ["REG money raised for ACE",27], ])} {this.simpleDistributionsTable([ ["speculative animal charities estimate",2000,500000,"I'm not providing calculations for this so you'll just have to make it up"] ])}| Estimate | {this.state.displayOriginalInputs &&(original) | }Notes |
|---|
| 10% CI | {this.state.displayOriginalInputs &&(original) | }90% CI | {this.state.displayOriginalInputs &&(original) | }Notes |
|---|
Here's all your data. You can copy someone else's data in if you want.