What's the Healthiest BMI?
TLDR: 20 to 22.
Confidence: Somewhat likely.
Last updated 2024-05-18.
Health organizations such as the American Heart Association recommend a body-mass index (BMI) of 18.5 to 25. But that’s a wide range. Surely we can say something more specific, right? I don’t want to know what’s acceptable, I want to know what’s optimal. What’s the exact best BMI for health?1
I couldn’t find an answer with a simple web search, which means now I have to write a post about it.2
Contents
- Contents
- The big BMI studies
- Do studies still overestimate ideal BMI?
- Details: Age, sex, ethnicity, and cause-specific mortality
- Exercise
- A final bit of evidence
- Changelog
- Notes
The big BMI studies
I read3 two big meta-analyses on BMI and mortality:
- Global BMI Mortality Collaboration (2016). Body-mass index and all-cause mortality: individual-participant-data meta-analysis of 239 prospective studies in four continents.
- Aune, Dagfinn; Sen, Abhijit; Prasad, Manya; Norat, Teresa; Janszky, Imre; Tonstad, Serena; Romundstad, Pål; Vatten, Lars J (2016). BMI and all cause mortality: systematic review and non-linear dose-response meta-analysis of 230 cohort studies with 3.74 million deaths among 30.3 million participants.
We have absolute mountains of data on the association between BMI and mortality. In spite of that, it’s hard to say what BMI minimizes mortality risk because it depends on how you interpret the data.
The raw mortality data says the healthiest BMI is 25—right on the cusp of the “overweight” range.
But that’s wrong because confounding variables make low BMI look worse than it really is. Smokers tend to weigh less, and various health problems cause people to lose weight.
If you adjust for smoking and health, and you also limit to studies with ≥15-year follow-ups to avoid confounding by undiagnosed illnesses,4 the ideal BMI is 20–22. Both meta-analyses agree on this conclusion (see Table 3 and Appendix eTable 8 in the first paper, and see the abstract in the second paper).
Here is a table of hazard ratios (i.e., mortality rates relative to the 22.5–25 BMI group), taken from the first meta-analysis:
| BMI | 18.5–20 | 20–22.5 | 22.5–25 | 25–27.5 |
| hazard ratio | 1.13 | 1.00 | 1.00 | 1.07 |
(Berrington de Gonzalez et al. (2010)5, a smaller (but still large) meta-analysis of 1.5 million white individuals, provides mortality data to a granularity of 1 point of BMI in its Supplemental Appendix, Figure 1. It finds a uniform mortality rate between 20 and 25.)
Mortality appears to increase slowly above 25 and more quickly below 20. If we interpolate the shape of the mortality curve, it looks like the exact ideal BMI just under 23.6 But I think that’s too high, as I will explain in the next section.
Do studies still overestimate ideal BMI?
I have reason to suspect that these meta-analyses somewhat overestimate the ideal BMI even after controlling for smoking, health, and study follow-up time. The Global BMI Mortality Collaboration’s Supplemental Appendix has a nice chart showing what happens when you successively adjust for confounders:
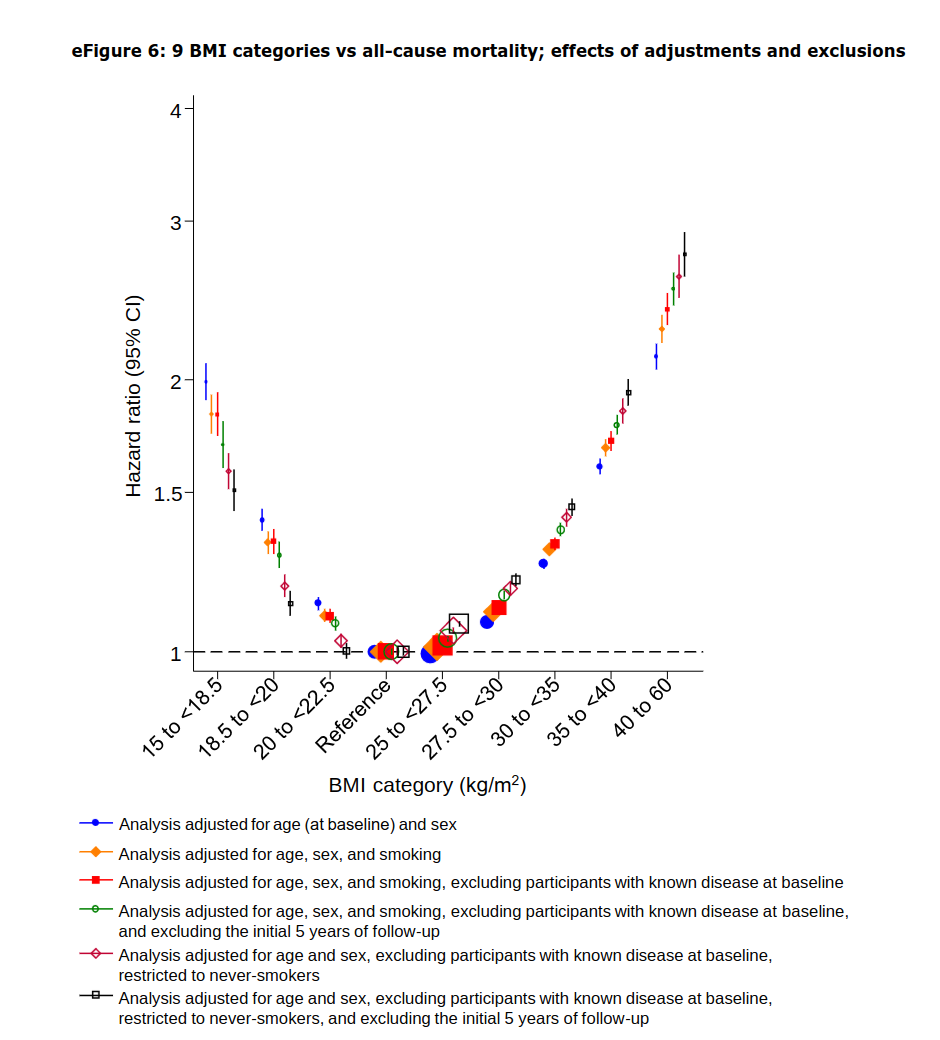
The Y axis shows mortality rate. Notice how the un-adjusted mortality rate for the 20–22.5 group starts out considerably higher than for the 22.5–25 group, and (almost) every time you adjust for a confounder, its mortality rate gets lower. By the end, the mortality rates for 20–22.5 and for 22.5–25 are nearly identical.
(More generally, as you adjust for more things, all BMI groups on the low end look better and all groups on the high end look worse.)
It seems likely that this meta-analysis didn’t adjust for every possible confounder. Whenever we make an adjustment, the lower BMIs look better. So presumably, if we adjusted for the as-yet-undiscovered cofounders, the ideal BMI would look lower than what these meta-analyses report.
And indeed, Aune et al. (2016) found that BMIs in the 20–22.5 range looked healthier than 22.5–25 when restricted to studies with a ≥20-year follow-up (see Appendix 2, Table E). Global BMI Mortality Collaboration (2016) tried restricting to >5-year follow-ups (in the green and black points shown in eFigure 6 above), but it appears that 5 years is not enough to fully eliminate confounding by undiagnosed diseases.
Aune et al. (2016)’s Table E reported hazard ratios by BMI with ≥20-year follow-up:
| BMI | 17.5 | 20 | 22 | 23 | 24 | 25 |
| hazard ratio | 1.06 | 0.99 | 0.99 | 1.00 | 1.02 | 1.06 |
The NCI Cohort Consortium meta-analysis5 found that both the 18.5–20 and 20–22.5 groups have lower mortality than 22.5–25 if you only look at studies with ≥15-year follow-ups—both the low-BMI groups had hazard ratios of 0.92 (see Table 2).
Before I said the ideal BMI was around 23. If we extrapolate the pattern of adjustments from Global BMI Mortality Collaboration’s eFigure 6, or look at Aune et al. (2016)’s 20-year follow-up data, it looks like the ideal BMI is more like 21. (But really, we could just as well say that the ideal BMI is anywhere from 20 to 22 because mortality doesn’t detectably vary within that range.)
Details: Age, sex, ethnicity, and cause-specific mortality
The Global BMI Mortality Collaboration study broke down mortality by age, sex, and cause of death (see Supplemental Appendix).
Ideal BMI (before adjusting for confounders) goes up with age:
| Age | Ideal BMI |
|---|---|
| 35–49 | 20–22.5 |
| 50–69 | 22.5–25 |
| 70–89 | 25–27.5 |
Ideal BMI does not vary by sex, but males are more sensitive to BMI than females. That is, females can tolerate greater deviations from the healthy BMI range without as much increase in mortality risk.
As far as I could find, there is no research whatsoever on the relationship between BMI and mortality for transgender people. Presumably, trans individuals should also target a BMI in the 20 to 22 range, but I can’t empirically confirm that.
There’s mixed evidence on BMI and ethnicity:
- In 2004, the World Health Organization suggested7 that most Asian sub-populations should use lower BMI cutoffs to define overweightness and obesity. A consensus statement on Asian Indians8 (the ethnicity that appears most sensitive to high BMI) proposed defining “normal” BMI for Indians as 18–23, overweight as >23, and obese as >25.
- A large UK study9 found that different ethnicities had different mortality rates on the low and high ends of BMI, but not in the middle, i.e., the healthiest BMI did not vary by ethnicity. (See Table S2.8 and Figure S2.7 in the Supplemental Appendix.)10 This is consistent with the consensus statements—the cutoffs for overweight/obese should probably vary by ethnicity—but it also suggests that ideal BMI does not vary much.
- There is theoretical reason to expect ideal BMI to depend on ethnicity. Namely, different ethnicities tend to distribute body fat differently, with Asians carrying more body fat at a given BMI than the average human, and blacks carrying slightly less. (But diabetes risk appears to increase slightly more rapidly with BMI for blacks than for whites, which contradicts this.11)
We simply don’t have enough evidence to draw strong conclusions about how ethnicity affects ideal BMI. As best I can tell, all ethnicities should target a BMI in the 20–22 range.
Ideal BMI varies by cause of death. This table (adapted from Global BMI Mortality Collaboration’s Supplemental Appendix, eTable 15) shows the hazard ratios for four BMI ranges broken down by some of the most common causes of death.
| 18.5–20 | 20–22.5 | 22.5–25 | 25–27.5 | |
|---|---|---|---|---|
| coronary heart disease | 0.95 | 0.89 | 1.00 | 1.18 |
| other cardiovascular disease | 1.14 | 0.98 | 1.00 | 1.11 |
| stroke | 1.15 | 1.01 | 1.00 | 1.05 |
| respiratory disease | 1.73 | 1.22 | 1.00 | 1.00 |
| cancer | 1.01 | 0.96 | 1.00 | 1.05 |
The second meta-analysis, Aune et al. (2016), claimed “weight loss can precede the diagnosis of some neurological and respiratory diseases by as much as 10-15 years.” The effect discussed in the previous section, where longer follow-ups make lower BMIs look better, appears primarily driven by neurological and respiratory disease.
Exercise
Exercise has two major confounding effects:
- Much of the harm of a high BMI comes from a living sedentary lifestyle. Controlling for cardiorespiratory fitness makes BMI look less important, especially at high BMIs.12
- Resistance training increases muscle mass, which raises BMI but not in a harmful way. If you control for resistance training, that should lower the apparent ideal BMI for low-muscle individuals while raising it for high-muscle individuals.13
(I thought exercise might have a third effect: exercise disproportionately reduces respiratory disease, which makes low BMI look healthier. This turned out to be true, but adjusting for it only reduces the hazard ratio for the 20–22.5 group by 1%.14)
In a meta-analysis, Barry et al. (2013)12 found that physical activity substantially reduces the negative health effects of overweightness and obesity, but did not look at how physical activity affects individuals with a BMI of less than 25.
Is exercise more helpful for overweight than for underweight individuals? (If so, that could raise the ideal BMI for physically active people.) Or is it equally good on both ends of the BMI spectrum? (In which case the ideal BMI wouldn’t change.)
I found three studies which suggest that it’s the latter: exercise expands the healthy BMI range without obviously changing the ideal BMI.15
While we’re on the subject of exercise, I should mention that exercise matters more for health than BMI, especially if you already fall within the “normal” BMI range. Exercise halves your mortality rate16 (for the collective “you”; individual results may vary). Moving your BMI from 25 to 22 only decreases your mortality rate by around 5%.
(Reducing BMI from 25 to 22 has an effect size of 0.5. Going from sedentary to physically active (as defined by the physical activity guidelines17) has an effect size of 17.)
A final bit of evidence
In Eat, Drink, and Be Healthy, Walter Willett—who co-authored the Global BMI Mortality Collaboration meta-analysis—had this to say about the ideal BMI.
The 2015–2020 Dietary Guidelines for Americans sets healthy weights as those corresponding to BMIs between 18.5 and 25. […] Panel members agreed that the risk of heart disease, diabetes, and high blood pressure begins to climb at a BMI of 22 or so. But they didn’t feel justified choosing such a low number as the cutoff between healthy and unhealthy weights, because doing so would have labeled a large majority of the U.S. population as overweight. […] [B]ut many people with a BMI of 23 to 25 are not at their healthiest weight.
[…]
What about BMIs under 18.5, which the government’s tables say isn’t healthy? This can, indeed, signal an unhealthy weight, especially if an individual has been losing weight or has an eating disorder. But people who have maintained a low BMI while eating healthfully and being active are usually just fine and have no reason to increase their weight.
Changelog
- 2024-05-18: Add a comment on BMI for transgender people, and fix a numeric error.
Notes
-
It makes sense why the American Heart Association doesn’t care about knowing the exact best BMI: why worry about people with slightly sub-optimal BMIs when a third of Americans have BMIs over 30? From a population-level perspective, getting everyone with a BMI of 24 down to 22 would reduce mortality by approximately zero percent.
But my BMI is 24 and I would like to know if I should lower it. ↩
-
In the process of writing this post, I went through this cycle five times:
- My research is done! I will do a final read-through to tighten up the prose.
- (in the middle of reading) Hmmm, this part makes me wonder about something. I will investigate further.
- (5 hours later) Ok, I think I’ve figured it out. Let me write up these new findings.
- (post is now 500 words longer) My research is done! I will do a final read-through to tighten up the prose.
At no point in my many revisions did the TLDR change, so maybe it was all a waste of time, but at least now I have 14 citations instead of three, which makes me look more scholarly. ↩
-
By which I mean I read the introduction and conclusion and looked at the tables and figures. ↩
-
Honestly I don’t fully understand the reasoning behind this, but both meta-analyses claim that short-term studies are confounded by undiagnosed diseases that decrease BMI and increase mortality.
I think the idea is that long-term studies ignore anyone who dies in the first few years, and anyone who dies after that probably didn’t have an undiagnosed illness at the beginning of the study or else they would have died sooner. Many studies use 5-year delays to combat this, but apparently many illnesses go undiagnosed for more than 5 years, and you need at least 15 years to eliminate confounding. In fact, Aune et al. (2016) found that even a 15-year follow-up is noticeably more confounded than a 20-year follow-up—see Appendix 2, Table E. ↩
-
Berrington de Gonzalez A, Hartge P, Cerhan JR, Flint AJ, Hannan L, MacInnis RJ, Moore SC, Tobias GS, Anton-Culver H, Freeman LB, Beeson WL, Clipp SL, English DR, Folsom AR, Freedman DM, Giles G, Hakansson N, Henderson KD, Hoffman-Bolton J, Hoppin JA, Koenig KL, Lee IM, Linet MS, Park Y, Pocobelli G, Schatzkin A, Sesso HD, Weiderpass E, Willcox BJ, Wolk A, Zeleniuch-Jacquotte A, Willett WC, Thun MJ. Body-Mass Index and Mortality among 1.46 Million White Adults. ↩ ↩2
-
I took the four groups from 18.5 to 27.5 (I included the 25–27.5 group because it has similar mortality risk to 18.5–20) and fitted a quadratic curve to them. The curve had a minimum at 23.1.
Originally I tried fitting a quadratic curve to eight BMI groups (from 15 BMI up to 40), but the curve wasn’t a good fit. When I fit the eight groups to a quartic curve, it fit well and had a minimum at 22.7, although a fourth-degree polynomial might have too many degrees of freedom.
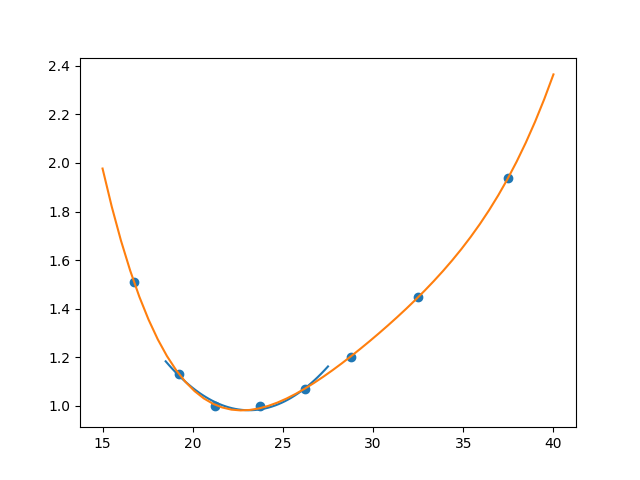
(The quadratic curve is the little blue one, and the quartic curve is the big orange one.) ↩
-
WHO Expert Consultation. (2004). Appropriate body-mass index for Asian populations and its implications for policy and intervention strategies. ↩
-
Misra A, Chowbey P, Makkar BM, Vikram NK, Wasir JS, Chadha D, Joshi SR, Sadikot S, Gupta R, Gulati S, Munjal YP. (2009). Consensus Statement for Diagnosis of Obesity, Abdominal Obesity and the Metabolic Syndrome for Asian Indians and Recommendations for Physical Activity, Medical and Surgical Management. ↩
-
Bhaskaran K, dos-Santos-Silva I, Leon DA, Douglas IJ, Smeeth L. (2018). Association of BMI with overall and cause-specific mortality: a population-based cohort study of 3·6 million adults in the UK ↩
-
This study had wide confidence intervals on its mortality rates for non-white ethnicities because most subjects were white. And the study only covered UK residents, which could affect the results due to local diet or selection effects from immigration. But it was the only study I could find that looked at all-cause mortality by ethnicity. I found good studies that looked at diabetes morbidity, but no others on all-cause mortality. ↩
-
Shai I, Jiang R, Manson JE, Stampfer MJ, Willett WC, Colditz GA, Hu FB. (2006). Ethnicity, Obesity, and Risk of Type 2 Diabetes in Women. ↩
-
Barry VW, Baruth M, Beets MW, Durstine JL, Liu J, Blair SN. (2013). Fitness vs. fatness on all-cause mortality: a meta-analysis. ↩ ↩2
-
Abramowitz MK, Hall CB, Amodu A, Sharma D, Androga L, Hawkins M. (2018). Muscle mass, BMI, and mortality among adults in the United States: A population-based cohort study. ↩
-
Zhao et al. (2020)16, a cohort study on exercise and mortality,18 reports in Table 2 that exercise has a hazard ratio of 0.48 on all-cause mortality (meaning people who meet the physical activity guidelines17 are only 48% as likely to die as people who don’t). A table of relevant hazard ratios for individuals who meet the exercise guidelines:
All-cause mortality Lower respiratory disease Flu/pneumonia hazard ratio 0.48 0.21 0.36 hazard ratio, controlling for BMI and other lifestyle factors 0.58 0.29 0.45 Whether we control for BMI or not, exercise has a bigger effect on respiratory disease than on all-cause mortality. To calculate how much this matters, we need to know what proportion of people die of respiratory disease.
Our World in Data says that, for North America and Europe, respiratory illnesses account for around 10% of deaths, and they consist of around 2/3 upper respiratory and 1/3 lower respiratory disease. Using the weighted average of the exercise hazard ratios from Zhao et al. (2020) gives an overall hazard ratio for respiratory disease of 0.40.
I calculated exercise and BMI hazard ratios for all causes excluding respiratory disease as the solution to
all-cause HR = 0.1 * respiratory HR + 0.9 * non-respiratory HR.Then I adjusted the BMI mortality rates for respiratory disease and for non-respiratory mortality using the respective exercise hazard ratios and re-combined them into an all-cause HR for physically active individuals.
I used the exercise HRs controlling for BMI rather than the uncontrolled HRs, on the theory that exercise probably lowers BMI on average, and we want to know the health effect of exercise irrespective of how it changes BMI.
It would be more accurate to fully break out mortality by cause instead of just breaking it into respiratory and non-respiratory, but I can’t really do that because Global BMI Mortality Collaboration (2016) and Zhao et al. (2020) don’t classify causes in the same way.
This table presents the hazard ratios (HRs) of different BMIs for people who meet the physical activity guidelines, accounting for respiratory disease (normalized so the 22.5–25 group has a HR of 1).
15–18.5 18.5–20 20–22.5 22.5–25 25–27.5 All-cause hazard ratio 1.51 1.13 1.00 1.00 1.07 All-cause HR with exercise 1.45 1.11 0.99 1.00 1.07 Accounting for the effect of exercise on respiratory disease did make lower BMIs look slightly better, but it made hardly any difference. ↩
-
- Berrington de Gonzalez et al. (2010)5 (in its Supplemental Appendix, Table 7)19 found that physical activity reduced hazard ratios for both low and high BMIs. It also slightly decreased the 20–22.5 BMI hazard ratio from 1.02 to 0.99, which could mean exercise slightly decreases the ideal BMI, but the change in hazard ratio was highly non-significant (p > 0.6) and non-monotonic (the moderate-activity group with 20–22.5 BMI had a hazard ratio of 0.97, lower than either the low-activity or high-activity group).
- Garfinkel et al. (1988)20 wrote that exercise had a greater effect on mortality for both underweight and overweight individuals than for normal-weight people, but the paper did not provide numbers.
- Lee & Kim (2020)21 looked specifically at underweight older adults and found that exercise had a hazard ratio of 0.68. Zhao et al. (2020)16 found an exercise hazard ratio of 0.48 for the general population, but Zhao used a stricter definition of physical activity, so these numbers aren’t directly comparable.
-
Zhao M, Veeranki S P, Magnussen C G, Xi B. (2020). Recommended physical activity and all cause and cause specific mortality in US adults: prospective cohort study. ↩ ↩2 ↩3
-
To meet the physical activity guidelines, you must do both
- At least one of:
- 150 minutes of moderate physical activity per week
- 75 minutes of vigorous physical activity per week
- Muscle strengthening activity at least two days per week
- At least one of:
-
I cited this cohort study instead of a meta-analysis because I couldn’t find any meta-analyses that looked at exercise and cause-specific mortality, specifically including respiratory disease. The 2018 Physical Activity Guidelines Advisory Committee report (which is the most comprehensive meta-analysis I could find (it’s actually a meta-meta-analysis)) looked at all-cause mortality and heart disease, but not respiratory disease. ↩
-
Berrington de Gonzalez et al. (2010) only included white individuals. The mortality <> BMI relationship varies a little bit with race, but I have no reason to believe that race affects the effect of physical activity. ↩
-
Garfinkel L, Stellman SD. (1988). Mortality by relative weight and exercise. ↩
-
Lee I, Kim B. (2020). Association between Estimated Cardiorespiratory Fitness and All-cause Mortality in Underweight Older Adults. ↩