Donation Timing Under Uncertainty About AI Timelines
A few years back, I got a big pile of money from working at a tech startup. I put a lot of that money into a donor-advised fund. Since now I make hardly any money, that DAF might represent the majority of my lifetime donations. How much of my DAF should I donate per year?
In particular, how much should I donate in light of short AI timelines?
I created a simple model to answer this question.
The basic concept: After the singularity, my money doesn’t matter anymore. I want to donate an equal amount of money every year from now until the singularity. But I don’t know when the singularity will happen. How much should I donate each year (in terms of % of starting wealth)?
The reason for donating an equal amount each year is that there’s a tradeoff between early and late donations:
- Early donations can have compounding effects.
- Late donations happen when you have better information.
If you’re unsure about which side of the tradeoff matters more, then it’s reasonable to distribute donations over time.1
If I had perfect knowledge of when the singularity will happen, I’d donate an equal amount each year. But I’m uncertain about the timeline. Instead, I can calculate how much to donate given a distribution over possible timelines.
The idea is, if the singularity happens five years from now, I want to donate 20% per year. If it happens 10 years from now, I’d rather donate 10% per year. If I’m evenly split between those two possibilities, then I should allocate half my budget to each strategy:
- With half my money, donate 20% per year.
- With the other half, donate 10% per year.
Therefore, I donate 15% for the first five years and 5% for the last five (if we make it that far).
My model takes a version of this approach where my AI timeline follows a probability distribution, rather than just having two possibilities.2
I modeled two different probability distributions: log-normal and Pareto.
- A log-normal distribution assumes that timeline is as likely to be 2x the median as it is to be half. The probability diminishes quickly when you multiply the timeline by larger and larger numbers.
- A Pareto distribution is fatter-tailed—it assumes more probability to long timelines than a log-normal distribution does.
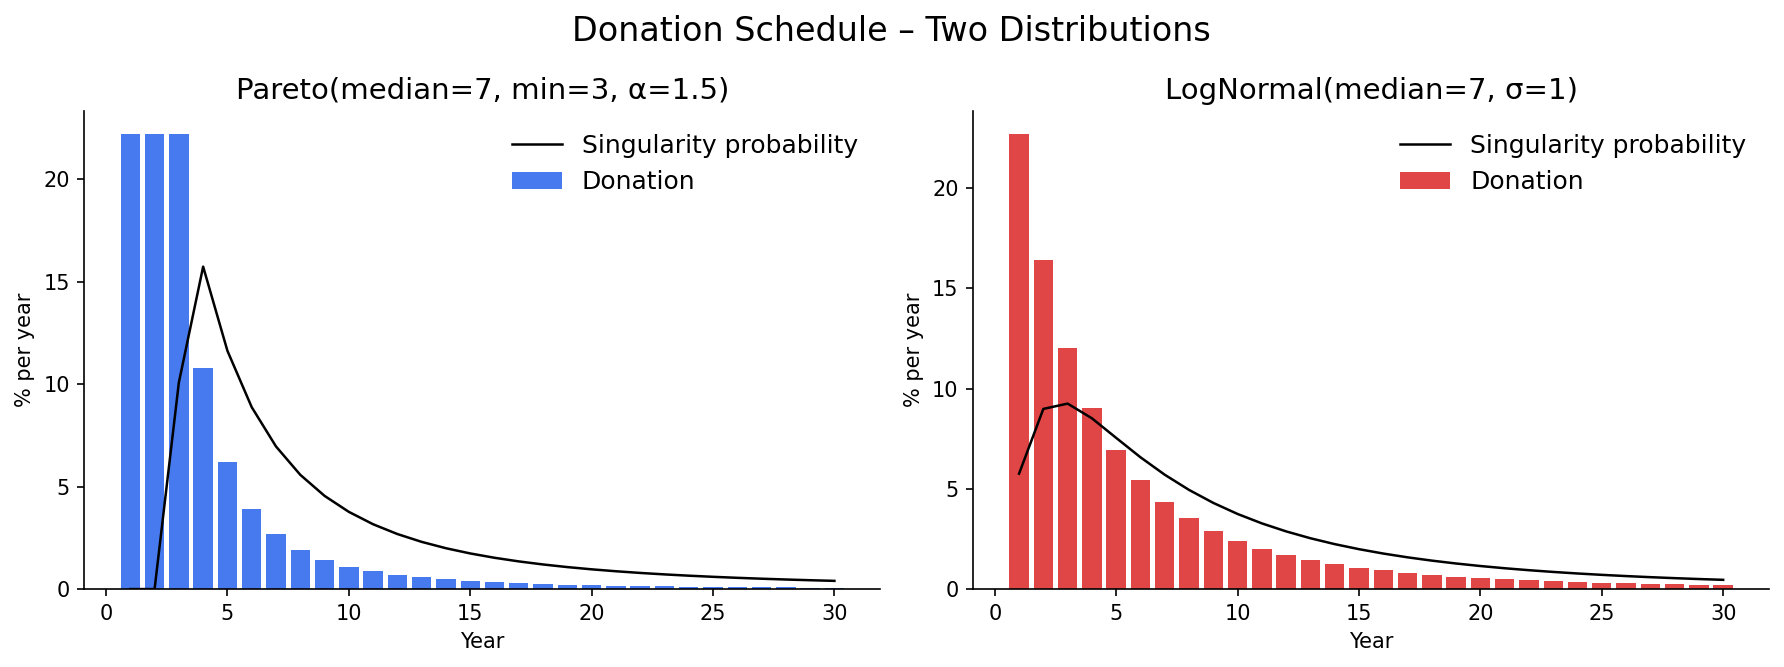
I’ve plotted two charts showing the optimal donation amount per year, as a percentage of starting wealth (so that the donation amounts will always sum to 100%). For these charts, I assumed a median timeline of 7 years. A Pareto distribution requires a minimum, so I set the minimum at 3—i.e., the singularity will definitely not occur until at least three years from now.
The models also have \(\sigma\) and \(\alpha\) parameters (respectively), which determine the widths of the distributions.
- For a log-normal distribution, \(\sigma\) is the number such that 68% of the probability lies within the interval \(\frac{\mu}{\sigma} <= x <= \mu \sigma\), and 95% lies within \(\frac{\mu}{2 \sigma} <= x <= \mu 2 \sigma\).
- For a Pareto distribution, \(\alpha\) determines how quickly the probability falls off: probability density is proportional to \(x^{-(\alpha + 1)}\).
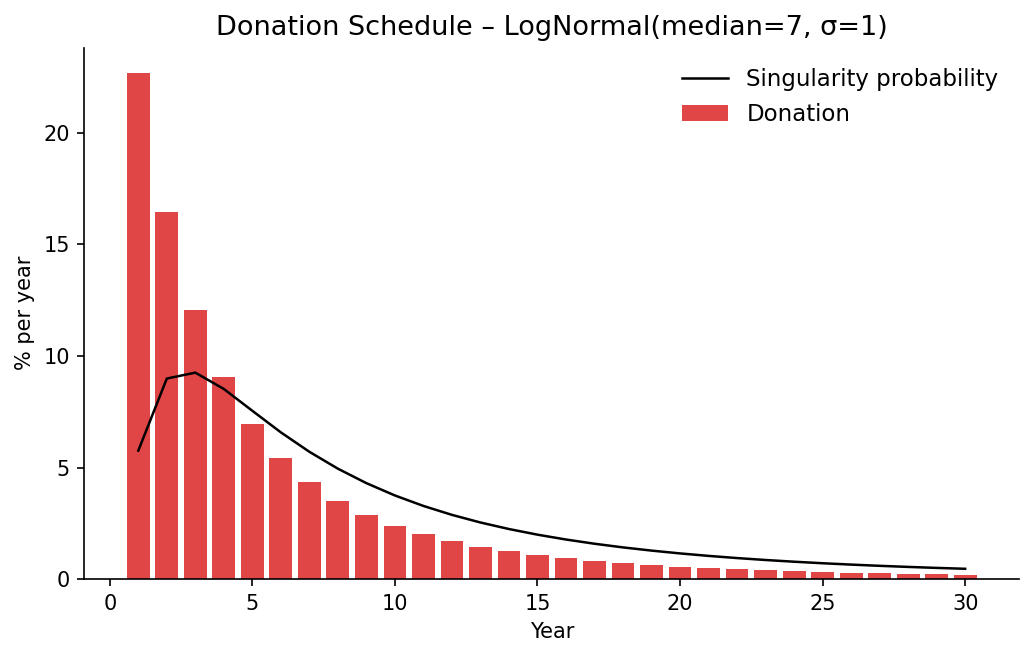
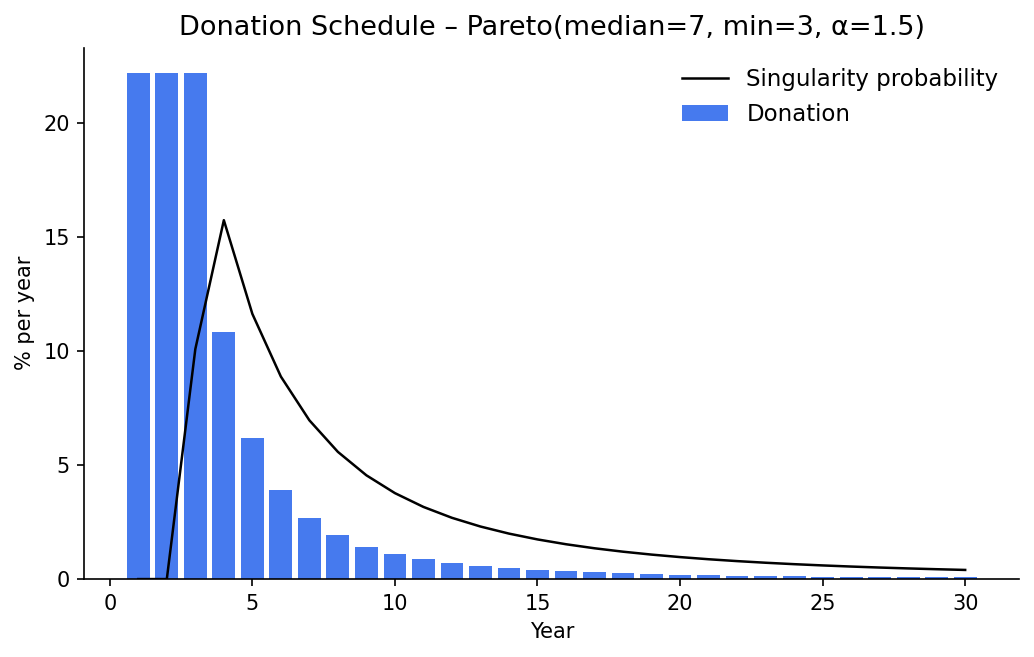
These two charts aren’t too different: they both recommend donating around 20% initially, and then donating diminishing amounts as time goes on. The Pareto model donates more up front and the amounts diminish rapidly, whereas in the log-normal model, the donations are a bit more spread out.
Rather than blindly following the model every year, it’s better to re-calculate before each donation because you gain new information over time. At minimum, the fact that the singularity hasn’t happened yet changes the probability distribution.
This model makes many simplifications. I considered several modifications that would make the model more realistic, but none of them seemed useful enough to justify their complexity.
Some possible model extensions:
- Rather than donating an equal amount each year (conditional on known date of singularity), explicitly model the tradeoff between giving now vs. later.
- Include the investment rate of return.
- Represent the timeline distribution as a mixture of several distributions.
- Model the possibility of a slow takeoff, rather than a discrete singularity.
Source code is available on GitHub.
Notes
-
The tradeoff has more than two considerations, but I will ignore the others for the purposes of this model. ↩
-
The donation amount for year T is given by
\[D(T) = \displaystyle\int_T^{T_f} \frac{1}{t} f(t) dt\]where
- \(f(t)\) is the probability density of the singularity occurring at time t
- \(T_f\) is the final year (defined to make the simulation finite)