Results from the Population Ethics Quiz

Two weeks ago, I released a population ethics quiz. 582 people took it.1 Here’s what I learned from reading the responses.
Contents
- Contents
- Preamble, and a new edition of the quiz
- Which classes of views were most popular?
- Most people were unconflicted
- Did people answer differently if they were already familiar with population ethics?
- The people were divided (except for me and my cool friends)
- Which questions were the most divisive?
- The “most normal” view was held by almost no one
- Clusters of answers
- Which conflicts arose the most?
- Which bullets were bitten the most?
- Lizardman’s constant is hard to estimate, but maybe it’s 1%
- I spent way too much time wrestling with the details of views that almost nobody believed in, and still managed to miss some views
- Future work: Does this teach us anything about population ethics?
- AI usage disclosure
- Appendix A: Complete list of possible conflicts and bullets bitten
- Appendix B: Changelog of post-publication quiz changes
- Notes
Preamble, and a new edition of the quiz
I was worried that I’d only get like four people taking the quiz. But that turned out not to be a problem, because people really like taking quizzes! Even when they’re about difficult philosophical subjects! Some people even reported that this quiz helped them learn about population ethics. That wasn’t part of my plan, but I’m glad it turned out to be a useful educational tool.
I have released version 2 of the quiz. Version 2 includes some additional questions to distinguish between the total view and four different flavors of negative-leaning view.2
Now for my findings. I did not pre-register any hypotheses; I just looked at the data to see what seemed interesting.
Which classes of views were most popular?
The quiz classified people’s responses into one of five standard views of population ethics. Most responses clustered near a standard view, but there was a long tail of responses that couldn’t be classified.
(Note: This classification was not always accurate; someone in a particular bin might not necessarily lean toward that view. I will say more about the challenges of answer profile classification later.)
Most people were unconflicted
If you complete the quiz without surfacing any contradictions, the quiz says:
Nothing you said conflicts with anything else you said. That’s rarer than you might think.
Well, turns out it’s more common than I might think! The majority of respondents gave internally consistent answers.
That said, my audience is more likely than most to have thought about population ethics before. Two days after publishing, I edited the quiz to ask:
Before taking this quiz, had you heard of the repugnant conclusion?
Turns out most people had:
Among the familiar, 27% had a conflict. For the unfamiliar, the number was 38%—higher, but still a minority.
Did people answer differently if they were already familiar with population ethics?
Yes, very!
People who expressed familiarity with population ethics3 were more likely to lean toward totalism:
Unfamiliar quiz-takers were more likely not to fall into any of the big categories:
Person-affecting views were unpopular for both groups, which surprised me—they represented only 5% of familiar respondents and 9% of unfamiliar.
Unfamiliar quiz-takers’ answers were also more distinct. Out of 151 respondents, 112 gave totally unique answers—nobody else answered the questions in the exact same way. The most popular answer profile was average utilitarianism,4 but only 9 people’s answers exactly matched it.
More stats on answer distinctness:
| Unfamiliar | Familiar | All | |
|---|---|---|---|
| Total respondents | 151 | 280 | 582 |
| Distinct answer profiles | 124 | 123 | 286 |
| Unique answer profiles | 112 | 96 | 240 |
| Frequency of most popular answer profile | 9 | 101 | 146 |
(Familiar respondents had fewer distinct answer profiles, even though that group had nearly twice as many respondents!)
How did they answer individual questions differently?
There are 13 mandatory questions. Many of the questions had low p-values—more than you’d expect by random chance5—so I’m confident that the “familiar” and “unfamiliar” groups answered differently overall.
After a Holm-Bonferroni correction on chi-squared tests, six questions had significant differences at p < 0.001, and twelve at p < 0.05.6
For the six questions with p < 0.001, here are the answers that each group favored much more than the other group:7
| Unfamiliar | Familiar | |
|---|---|---|
| The same number, different people | they cannot be ranked | second is better |
| A against B | A is better | B is better |
| Benign addition (A vs. A+) | A is better8 | A+ is better |
| A against Z | A is better | Z is better |
| Adding a wonderful life (K vs. K++) | (all other answers) | K++ is better |
| Choosing from three (A, B, Z) | A is best; A and B both; all three | Z is best |
For the familiar, by far the most common nearest-catalogued-view was totalism (46%); for the unfamiliar, the most popular near-match was the critical-level view (18%), but there were few exact matches.
The people were divided (except for me and my cool friends)
People gave diverse answers. Almost no set of answers was agreed upon by more than a few people: the second-biggest set only included 19 people.9
But there was one big exception: the largest group contained 146 people, and it just so happens that I was in that group, too.10 They call us the total view crew.
When including near-matches, these were the five most popular of the catalogued views:11
Which questions were the most divisive?
On a few questions, people were nearly unanimous: Pareto improvements are good (96% agreement); adding a miserable life is bad (92%). Here are the questions where people were the most evenly split:
| Question | Leading two | Split |
|---|---|---|
| Choosing from three (A, B, Z) | Z vs. A | 55% / 45% |
| A against B | B is better vs. A is better | 55% / 45% |
| A against Z | A is better vs. Z is better | 58% / 42% |
| Repeating the moves | Yes – the same at every rung vs. No – somewhere my verdict flips | 61% / 39% |
The great debate: A vs. B
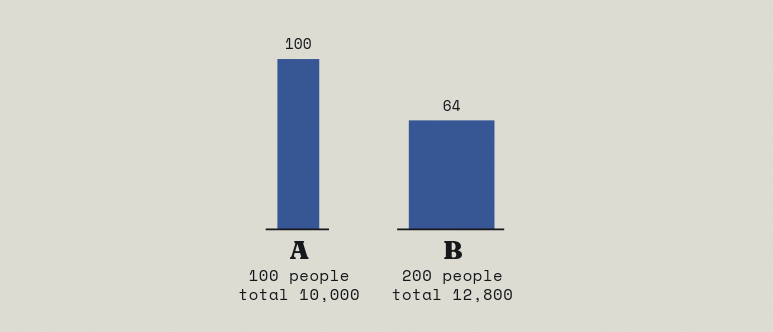
This was the most controversial binary question. Of the people who ranked one as better than the other, 55% preferred B and 45% preferred A.
In a way, A vs. B is the premier question: your choice forces you down a path that requires you to bite a bullet lest you face an internal conflict.
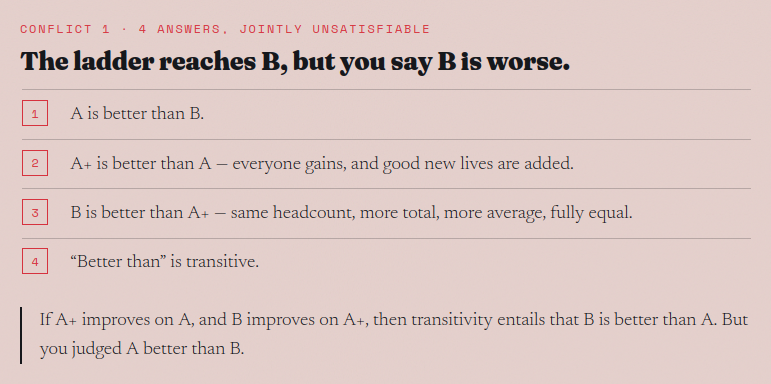
Choosing A over B sets you against at least one of three intuitions:
- Benign addition: A+ has the same people as in A, but slightly better off; and it adds another 100 moderately-happy people.
- Levelling up: B has the same people as in A+, but everyone’s welfare is equalized and then slightly increased. Outcome B has higher total welfare, higher average welfare, and more equality.
- Transitivity of better-than: If A+ is better than A, and B is better than A+, then B is better than A.
How did the A-preferrers resolve (or fail to resolve) this conflict?
- 86 (42%) rejected the benign addition.12
- 52 (24%) rejected levelling up.
- 44 (21%) rejected transitivity of better-than.
- 61 (29%) failed to resolve the conflict.
(These are not mutually exclusive.)
Choosing B over A leads you down the ladder to the repugnant conclusion. There are four possible responses:
- 178 (70%) accepted the repugnant conclusion—they said Z is better than A (question 9).
- 72 (28%) said their verdict flips somewhere down the ladder (question 8).
- 37 (15%) rejected transitivity of better-than.
- 3 (1%) rejected the repugnant conclusion but failed to resolve the conflict.
(Some of those numbers surprised me. I thought most people would prefer B over A while simultaneously disliking Z. However, most people (70%) who preferred B also accepted the repugnant conclusion.)
The “most normal” view was held by almost no one
What does the average person say about population ethics? I took the most popular answer on every question to see what result it gave. Much like how the average family has 2.5 kids, almost nobody gave the modal answer on every question. To be precise, only one out of 582 respondents exactly matched the modal view.
Here’s a link to the modal view. It accepts every step of the mere addition paradox, rejects the repugnant conclusion when asked about A vs. Z, but then says Z is better than A when presented with A, B, and Z together. This is pretty close to an untutored intuitionist view, except that an intuitionist would never say Z is better than A.
Part of why the modal view is so weird is that a voting bloc of total-view supporters just barely managed to make Z the top answer in the {A, B, Z} comparison, but they didn’t have enough votes to make Z beat A in the direct matchup. What happens if we kick out everyone who was already familiar with population ethics, and just look at the modal answer among the unfamiliar group?
Here’s the “unfamiliar” modal view.
The pre-made list of views includes a view called “the untutored intuitive package”, which represents how Claude expected many people to answer.
The unfamiliar modal view exactly equals the untutored intuitive package. Well done, Claude!
In short, this view says it’s good to add more welfare, except that A is better than B, and A is better than Z. It’s one of the few views that bites no bullets—everything it says is intuitive. The only problem is that it can’t possibly be correct, because it has two internal conflicts.
(There’s another view called Procreation Asymmetry, prefer greater utility (B > A). That one was my guess at what would be the most popular view among the general public. Claude’s prediction was much more accurate than mine. In my defense, I haven’t read the entire internet.)
However, dispersion among unfamiliar respondents was wide: only three people gave answers that exactly matched the unfamiliar modal view.
The modal answer set among “familiar” respondents exactly equaled the total view. Even though totalism was still a minority view among familiar respondents, they formed a strong enough voting bloc that they controlled the modal answer set.
Clusters of answers
The quiz attempts to classify people into six categories: total view; average view; critical-level or lexical view; person-affecting view with symmetry; person-affecting view with asymmetry; none of the above. But this classification didn’t always work. The main problem is that most people’s responses just don’t cleanly match up with views from the philosophical literature.
So as an alternative approach, I ran13 some analysis to form the responses into statistical clusters.14 I was able to identify three large clusters:
- total utilitarianism — 203 respondents (35%), 96% answer agreement15
- some flavor of intuitionism — 124 respondents (21%), 85% answer agreement
- average utilitarianism — 79 respondents (14%), 85% answer agreement
I’ll say more about the clusters below, with the caveat that these aren’t necessarily meaningful. Two completely different views might give identical answers on all questions but one, which gives the false impression that they’re closely related.
Cluster 1 - Total utilitarianism
The modal answer in this cluster is identical to the total view.
This was by far the strongest cluster:16 it was the largest, and it also had more internal agreement than any other decently-sized cluster.
This table shows the questions where the cluster had strong internal agreement, but significantly diverged from respondents outside the cluster.
| Questions & answers | This cluster | Everyone else |
|---|---|---|
| Choosing from three: Z | 96% | 2% |
| A against Z: Z is better | 95% | 2% |
| A against B: B is better | 88% | 19% |
| Repeating the moves: Yes – the same at every rung | 97% | 42% |
| Adding a modest good life: K+ is better | 96% | 58% |
Cluster 2 - Some flavor of intuitionism
This cluster’s view does not appear to have a simple description. The modal answer profile closely aligns with the untutored intuitive package, differing on only one question: on “repeating the moves”, this cluster does NOT make the same judgment at every rung of the ladder.
I call it “intuitionism” because it contains a conflict, and therefore does not represent an established philosophical view. Specifically, it ranks A+ better than A, B better than A+, and accepts transitivity, but also says A is better than B.
This table shows the cluster’s most differentiating questions and their answers.17 The cluster only shows strong differentiation in the top two answers.
| Questions & answers | This cluster | Everyone else |
|---|---|---|
| Repeating the moves: No – somewhere my verdict flips | 90% | 25% |
| A against Z: A is better | 90% | 36% |
| Adding a wonderful life: K++ is better | 98% | 80% |
| Adding a modest good life: K+ is better | 85% | 68% |
| Benign addition: A+ is better | 89% | 72% |
Cluster 3 - Average utilitarianism
The modal answer in this cluster is identical to the average view—the goodness of an outcome is determined by the average welfare of all lives. This cluster was smaller than the first two, representing 14% of answers, but its respondents were bunched more tightly than the ones in cluster 2.
| Questions & answers | This cluster | Everyone else |
|---|---|---|
| Adding a modest good life: K is better | 87% | 4% |
| Benign addition: A is better | 86% | 5% |
| Choosing from three: A | 90% | 20% |
| A against B: A is better | 87% | 27% |
| A against Z: A is better | 96% | 40% |
Which conflicts arose the most?
31% of users’ answers had at least one internal conflict. These were the most common:
The quiz identifies 11 conflicts that nobody triggered. Most of those 11 require saying (among other things) that two outcomes are exactly equal, which almost nobody did.
Which bullets were bitten the most?
98% of respondents bit at least one bullet. Here are the top five:
Among the unfamiliar, nearly 3x more people rejected transitivity (30%) than accepted the repugnant conclusion (11%)!
Lizardman’s constant is hard to estimate, but maybe it’s 1%
Lizardman’s constant is the percentage of survey respondents who give a ridiculous answer—because they misunderstood the question, or they just didn’t take it seriously, or something.
It’s hard to estimate Lizardman’s constant on this quiz because almost no answers are truly indefensible:
- You might think that Pareto improvements are definitely good, and anyone who says otherwise is either trolling or misclicked. But one might argue that there is no way to convert people’s welfare into a number, and therefore you can’t say that a larger welfare number is better.
- You might think that adding a life of misery is definitely bad. But one might argue that life has innate positive value, even if it’s an unhappy life.
(4% of respondents rejected Pareto, and 2% said adding a life of misery was an improvement.)
The only answer I can’t figure out how to justify is on question 2: if the first outcome has 100 people at welfare level 50, and the second outcome has 100 different people at welfare level 90, which is better? Most people (84%) agreed that the second is better. You could argue that they’re interchangeable (2%) or incomparable (13%). I don’t see how you could possibly argue that the first outcome is better; and yet 7 people (1%) answered that way. Therefore, I conclude that Lizardman’s constant is at least 1%. It could be higher, but I can’t say more than that because every other answer could be legitimate.
I’m not even entirely sure about that 1%. Maybe there’s some obscure argument why it’s actually better for people to be worse off?
There were a few answer profiles that I strongly suspect were not serious. A small number of people managed to bite 10+ bullets with no (detected) conflicts by giving very weird combinations of answers, such as by saying that adding Nadia with a miserable life makes things better, but adding Nadia with a wonderful life makes things worse—and also rejecting Pareto and transitivity, which makes it pretty much impossible to prove that the answers contain a conflict.
I suspect that some respondents misunderstood “Repeating the moves” (question 8)—I struggled to figure out how to explain it well, and I don’t think I fully succeeded. I think some people interpreted “No” to mean “I would not say the next level is an improvement”, when what it actually meant was, “whatever I said about my ranking of A and B, I would say something different further down the ladder”.
I spent way too much time wrestling with the details of views that almost nobody believed in, and still managed to miss some views
There are certain flavors of person-affecting view that were once believed to be internally inconsistent, until some clever philosopher found a way to avoid the contradiction by rejecting a hidden assumption. I wanted to be careful not to mark a set of answers as conflicting if there was a way out. I spent hours working out the details and adding optional questions to detect menu dependence (question 17) and Broome’s greediness of neutrality18 (question 12). Then hardly anyone answered in a way that made those questions matter.
In fact, only 44 people (7.6%) voted for any version of a person-affecting view. I really thought person-affecting views would be more popular than that.
In spite of all that time spent, I still managed to miss some prominent population-ethical theories. Commenter JKM pointed out that the quiz did not do a good job of capturing suffering-focused views (see also my reply).
(There are also some views that I deliberately didn’t cover because they would be too complicated, such as distinguishing between outcomes and acts.)
Before publishing the quiz, I made a list of named views including as many as I could think of, and I asked Claude to do a literature review to find more to add. When I launched the quiz, the list included 31 views.19 And yet, only 34% of respondents exactly matched one of the named views (19% of unfamiliar respondents and 44% of familiar ones).
Future work: Does this teach us anything about population ethics?
My analysis so far was purely descriptive: it was about how respondents answered the questions. I learned a lot about people from running this quiz, but not so much about population ethics itself.20 I feel like we ought to be able to learn something, but I’m not sure what.
As discussed above, it’s difficult to identify views purely by calculating statistical clusters. I’d like to figure out a more intelligent way of determining which views are related. This is a hard problem because it requires understanding the logical implications of different combinations of answers.
One thing that could’ve happened, but didn’t: A cluster of people could’ve aligned on an answer profile that does not map to any previously-named view. That would indicate the existence of a novel philosophical stance that deserves exploration.
However, there was no such cluster of answers. The answer profiles mostly formed around well-known views like totalism or averagism. People who didn’t align with an established view tended to be all over the map, with few such people exactly agreeing with each other.
The fact that there was no novel cluster suggests that there isn’t some undiscovered-yet-commonplace view of population ethics waiting to be formally described. Of course, just because the quiz questions failed to elicit any such view doesn’t mean that it doesn’t exist. The quiz is only as good as the questions it asks.
I want to know what a more representative sample would look like. Even the unfamiliar respondents were probably more reflective and philosophical than the average person.
I particularly wonder if there are insights to be learned from the subset of respondents whose answers contained no conflicts. Did their answers show certain trends or tendencies? And can their answers be considered evidence of what’s right? For example, if internally-consistent respondents systematically prefer particular answers, is that evidence that those answers are more likely to be correct?
AI usage disclosure
Almost all data analysis was done by a script written by Claude Opus 4.8, with code review by Claude Opus 5. I did not manually review the code because I’m reasonably confident that Claude can do the calculations correctly.
Claude’s full analyses are linked below:
- all quiz-takers
- “unfamiliar” responses only
- “familiar” responses only
- no-conflicts responses only (I didn’t write about this one, but maybe there’s something interesting in there)
Appendix A: Complete list of possible conflicts and bullets bitten
For a list of every conflict and bullet, along with the sets of answers that trigger them, see: https://mdickens.me/materials/pop-ethics-logic-reference.html
(The boilerplate text on that page was written by Claude.)
Appendix B: Changelog of post-publication quiz changes
I made a few changes to the quiz after it had already gone live:
- 2026-08-31: Realized I forgot to ask for consent to use answers, so I added a consent checkbox. 67 runs were completed before the checkbox was added; I excluded them from the analysis.
- 2026-09-02: Based on initial responses, it looked like the sample was heavily biased toward people who already knew about population ethics. I added a question about quiz-takers’ familiarity with population ethics so that I could analyze the “unfamiliar” cohort separately.
- 2026-09-09: Added a conflict card for “You called adding a modest life an improvement, then declined the same improvement.” None of the questions were changed, so I was able to apply this conflict card to the analysis retroactively, but it means that anyone who previously gave that particular set of answers was not presented with the conflict card. I didn’t realize until today that this specific combination of views constituted a conflict.
-
2026-09-12: Retroactively changed the rules for how to classify an answer profile as “critical-level or lexical view”. The original rule was that an answer had to not fall into any of the other catalogued views, and then it had to answer two questions as follows:
- A against Z: A is better.
- Benign addition (A vs. A+): A+ is better.
This was too permissive; it collected many answers that did not even resemble a critical-level or lexical view. Therefore, I changed the rules to also require the following two answers:
- Levelling up (A+ vs. B): B is better.
- Repeating the moves: My verdict flips somewhere on the ladder.
Notes
-
More accurately, 832 people took it; 582 people gave consent to use their answers.
This analysis only includes answers from before 6pm PDT on 2026-09-11. ↩
-
Me trying to add new questions on the same day I want to publish this post:
-
People were classified as “unfamiliar” if they answered “no”, and “familiar” if they gave either of the two “yes” answers. ↩
-
I use the word “utilitarianism” loosely in this post. I’m using the term to refer to axiology (what is good), not morality (what is right)—you don’t have to be a full-blown utilitarian to believe that, all else equal, it’s better for there to be greater utility. A deontologist could still be an average utilitarian with respect to population axiology if they believe more average welfare is generally better, while also believing that it is wrong to cause the deaths of marginally-happy people for the purposes of increasing average happiness. ↩
-
Claude did a Kolmogorov–Smirnov test and found an astronomically small p-value, but that test requires assuming the questions are independent, which they’re not. ↩
-
Before writing this, I didn’t know what a Holm-Bonferroni correction was; Claude just used it unprompted after I asked Claude to do a statistical analysis, and then I looked it up on Wikipedia afterward. Having now looked it up, it seems like a sensible approach.
For a Bonferroni correction, you divide the p-value by the number of hypotheses you tested, which is an extremely conservative way of correcting for false positives. A Holm-Bonferroni correction is more moderate. The way it works is:
- For your weakest p-value, you act as if that was your only hypothesis (you don’t adjust it at all).
- For your second-weakest p-value, you do a Bonferroni correction as if you’d tested two hypotheses (i.e. you divide by 2).
- For your third-weakest p-value, you do a Bonferroni correction as if you’d tested three hypotheses (i.e. you divide by 3).
- etc.
The Holm-Bonferroni method has a false positive rate no worse than if you’d tested a single hypothesis, and a lower false negative rate than the Bonferroni method. ↩
-
A chi-squared test tells you that the answers were different overall, not that any particular answer was more popular. I just eyeballed which answers had the biggest differences. ↩
-
These are relative preferences. A majority (59%) of unfamiliar respondents still ranked A+ better than A; for familiar respondents, the majority was more pronounced (85%). ↩
-
That second-most-popular answer profile was exactly the average view. ↩
-
I realized after writing this sentence that I hadn’t actually taken my own quiz! (At least, not while it was live—I took it about a hundred times while testing.) So I went back and took it. ↩
-
Numbers can be fractional because if an answer profile is equidistant between two or more catalogued views, partial credit is assigned to each of them. ↩
-
You can reject a step by reversing it (saying A+ is worse than A) or by declining to rank the two outcomes. You cannot avoid a conflict by saying they are equal, unless you also reject transitivity. ↩
-
By which I mean “asked Claude to run”. ↩
-
Clustering was determined using Ward’s method. I tried creating
kclusters forkbetween 3 and 20. It was apparent that there were only three major clusters, and any other clusters were small or loosely-connected. The three clusters I chose are the top three fromk=10; the exact sizes of the clusters slightly changes when you changek, although not by much—changingkmostly shuffles people between the loose clusters, and the top three were pretty stable.There was a fourth medium-sized cluster around geometrism with 26 respondents (4%) and 90% answer agreement. ↩
-
“Answer agreement” is defined as follows:
- Determine the most popular within-cluster answer to every question.
- For each member of the cluster, determine what percentage of their answers agree with the most popular answer.
- Take the average percentage across all members.
-
If you divide answers into
kclusters, the totalism cluster will be the largest for anyk >= 6. Atk < 6it’s the second-largest cluster, but the largest has much weaker cohesion (atk = 5, the largest has 79% agreement compared to 94% for totalism). ↩ -
Originally, the top five included two optional questions that few people were asked (“The modest addition against the harm” (question 13) and “Best of three, best of two” (question 19)). I filtered the list to only include questions that were seen by at least 20% of quiz-takers. ↩
-
Rabinowicz, W. (2009). Broome and the Intuition of Neutrality. ↩
-
As of this writing, the list includes 33 views because I added some more. I didn’t test quiz respondents against the new views because the new views are only compatible with version 2 of the quiz. ↩
-
I did learn about population ethics in the process of making the quiz. ↩