Compare Your Company Stock to a Leveraged Index Fund
Say you work at a private company that gives you stock options or RSUs. How should you value your stock?
- If you have a choice between getting more stock or more cash salary, how do you decide which to get?
- If you have the chance to sell some stock, should you do it?
Stock is risky and inflexible (especially if you work for a private company where you can’t easily sell shares), but you might be able to get it at a discount to its true value. How do you estimate how much it’s worth?
One heuristic you can use is to compare the stock against a risk-matched index fund. What would happen if you used the cash to buy a leveraged index fund with the same level of risk as the company stock? If the leveraged index fund has a higher expected return than the company stock, that means cash is probably better. (The reverse is not necessarily true because company stock can have other downsides, which I will get into later.)
How to compare stock to a leveraged index fund
You can’t know for sure how risky your company stock will be, but you can estimate. Large publicly-traded companies (worth $100 billion or more) tend to have about double the volatility of the US total market, and mid-sized companies (worth around $1-5 billion) have about triple the volatility. (For more on these numbers, see The Risk of Concentrating Wealth in a Single Asset.) That means if you work at a large company, you’re looking at a similar risk as a 2:1-leveraged index fund. And if you work at a $1 billion company, you should compare your stock to a 3:1-leveraged index. For even smaller companies in the $100 million range, 5:1 leverage is more appropriate.1
This graph shows standard deviation by market cap in the years from 1995 to 2015:
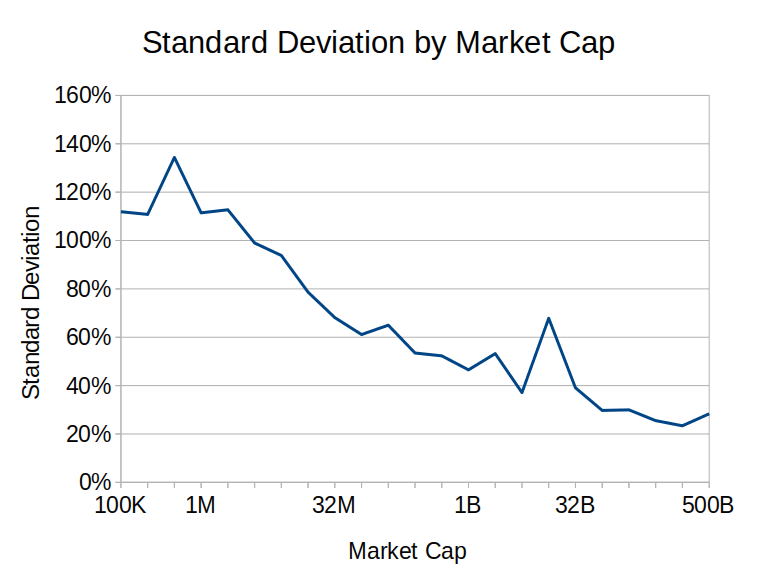
Private companies don’t really have standard deviations in the same way that public companies do, because their prices don’t change on a daily basis. But they’re still risky in the sense that if you wait to sell the stock, you might have to sell at a lower price (or even $0). It’s possible that public and private companies differ in some systematic way, where private companies of a given size are more risky (or less risky) than comparable public companies. But to keep things simple, let’s assume private and public companies work the same way.2
Suppose you have some employee stock at a $1 billion company. Based on historical averages, I’d assume that that stock is as risky as a 3:1-leveraged index. What does that imply?
If you have the choice between getting $1 cash and $1 worth of company stock, you need to expect your company stock to return at least 3x as much as the market to prefer the company stock over cash. If your company stock has a lower expected return than that, you’d get a better return with the same risk by just getting cash and then using it to invest in a leveraged index fund.
The beautiful thing about this method is you can get an answer without having to know anything about risk aversion. We levered up the index fund to the point where both potential investments have the same risk profile. That said, risk aversion can still matter because 3:1 leverage might be too much—you might prefer an un-levered index fund. The comparison only gives an answer in one direction:
- If your stock has 3x the risk of the market, but less than 3x the expected return, then it’s not as good, and you’d prefer cash.
- If your stock has 3x the risk of the market, and more than 3x the expected return, then this method can’t determine whether it’s better, because the answer depends on your risk preferences.
How to compare unequal dollar amounts
In many situations, you have to choose between unequal amounts of cash and stock. For example, maybe you’re offered a job at a startup, and you have a choice between:
- $100,000 salary + some equity valued at $50,000
- $75,000 salary + some equity valued at $100,000
So you can exchange $1 of cash for $2 worth of company stock. How can you figure out whether this is a good deal?
To make a direct comparison between $1 of a leveraged index fund and $2 of stock, we need to know how long we will hold the stock for. We rarely know precisely, but we can guess.
Suppose I expect my company to go public in about five years. Maybe I expect my company stock to return 10% annually above the risk free rate,3 and an index fund will return 5% above the risk-free rate,4 and therefore a 3:1-leveraged index will return an excess 15%.
(We care about excess returns rather than absolute returns because you have to pay the risk-free rate to use leverage. You could say the risk-free rate “doesn’t count”: you get to earn that rate no matter what, so you subtract it out when doing calculations.)
After five years, I believe I will be able to sell my company stock and do whatever I want with the money. How to I expect each asset to perform over those five years?
The index fund will start at $1 and compound at an excess rate of 15% (in expectation) over five years. 1.155 = 2.01, so I will have $2.01 in expectation at the end of the period. Meanwhile, the company stock starts at $2 and compounds at 10% excess over five years, resulting in $3.22.
Therefore, if you’re comfortable with the risk (and that’s a big “if”), the stock is better than the cash in this case.
We can use this method to calculate exactly how much stock is worth the same as $1 cash (according to our guesses). In this example, if we get $1.25 worth of stock, we will end up with $2.01—the same amount as if we took the leveraged index fund instead. Therefore, $1 of cash and $1.25 of stock look equally good on this comparison.
Don’t forget that this method only gives an answer in one direction. If the leveraged index has a greater expected value than the company stock, we can say cash is better. But if the stock looks better than the leveraged index, we can’t say we should choose the stock, because it might be riskier than we want.
This method requires making some guesses about the future, and it embeds some assumptions that might be false. (For example, it assumes that the index fund and the company stock follow the same distribution shape.) It cannot conclusively tell you how much to value company stock, but I find it to be a useful lens for thinking about the problem.
I spent a while trying to figure out if there’s a simple way to compare cash to stock in the case where stock looks better than a levered index, but you’d prefer to take on less risk. As far as I can tell, there is no simple answer. You have to compare them the hard way—by coming up with your utility of money and then applying your utility function to each choice. Or, if you’re a normal person and not obsessed with quantifying everything like I am, you can just compare them qualitatively.
Calculator
I have included a simple calculator to determine how much company stock is worth the same as $1 in an index fund, according to the assumptions made in this post. It calculates these four numbers:
- company standard deviation as a function of size
- how much leverage an index fund would need to reach the same level of volatility
- what expected return that leveraged index fund would get
- how much company stock is equivalent to $1 in a leveraged index fund, taking into account the time until liquidity
Notes
-
Volatility (standard deviation) is not a perfect measure of risk. Compared to a leveraged index fund, an individual company has a much higher risk of going to $0. In a way, looking at volatility understates how risky individual stocks are. ↩
-
Many private equity managers like to pretend that private stocks are less volatile. Don’t listen to them. During market crashes, managers can get away with not re-rating the valuations of their private companies, and claiming no loss. But if they had to sell their shares during a downturn, the sell price would be lower. ↩
-
The risk-free rate is the interest rate you can earn while taking on no risk of losing money. It makes sense to subtract out the risk-free rate from any rate of return we’re looking at, because the difference shows us what we are actually getting in exchange for the risk we’re taking on. Subtracting out the risk-free rate usually makes the math much simpler. ↩
-
Investment writer Meb Faber frequently talks about the 5:2:1 rule: in the long run, stocks have returned 5% after inflation, bonds returned 2%, and the risk-free rate was 1%. According to this, the stock return over the risk-free return is 4%, but we can round it up to 5% for the sake of simplicity. ↩