Results from Version 2 of the Population Ethics Quiz

On the same day as I published the results from my population ethics quiz, I also introduced version 2 of the quiz. The new version adds some new questions to distinguish between types of people who accept the repugnant conclusion. It distinguishes between classical views, which treat happiness and suffering as symmetric, and negative-leaning views, which give special weight to suffering.
I’ve now gotten 192 results from new quiz-takers. Here are the findings.
Contents
- Contents
- Categories of negative-leaning view
- How people answered the new questions
- Did v2 quiz-takers answer differently on the pre-existing questions?
- How this changes the results from v1
- Totalist answers clustered more strongly than negative-leaning answers
- Notes
Categories of negative-leaning view
Of the 192 respondents, 53 (28%) accepted the repugnant conclusion and were asked the follow-up questions. Those quiz-takers can be distinguished into four types of views, each described in the full list of views. One of the four is the total view. The other three are different types of negative-leaning view:1
- Constant-factor negative-leaning: Happiness and suffering both aggregate linearly, but suffering is worse than happiness by a constant factor.
- Sub-linear aggregation: Happiness and suffering both count, but suffering aggregates linearly, while happiness aggregates sub-linearly. Twice as much suffering is twice as bad, but twice as much happiness is less than twice as good.
- Lexical negative utilitarianism: Suffering is lexically worse than happiness. Any amount of suffering (no matter how small) outweighs any amount of happiness (no matter how large).
These categories were tested with some new questions.
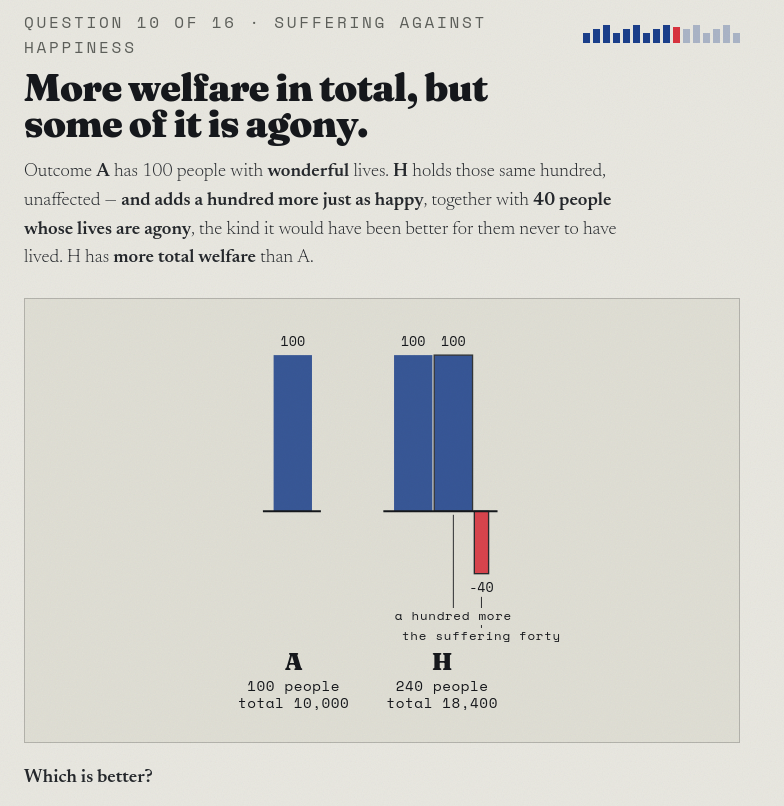
If you accept the repugnant conclusion, the quiz presents you with two additional questions:
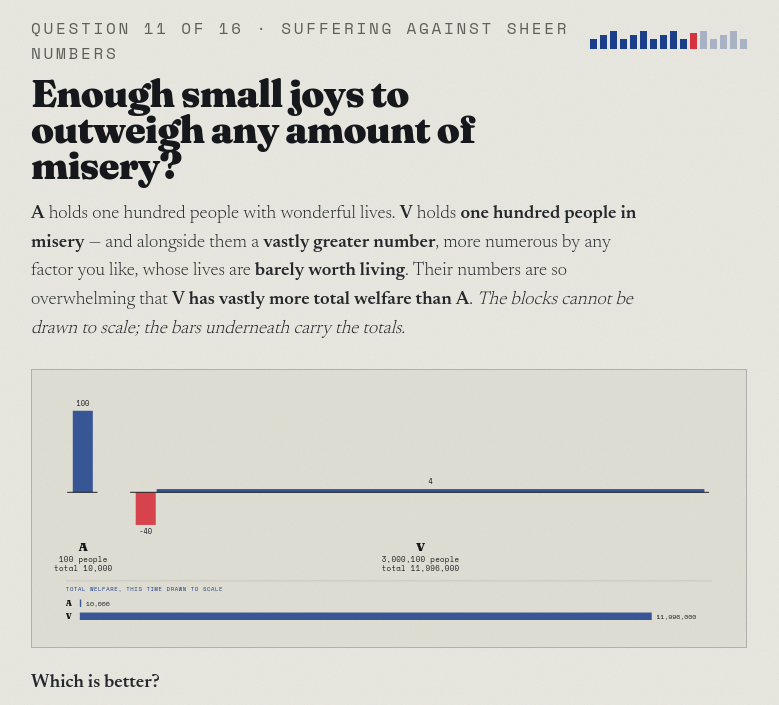
The second question tests the so-called “very repugnant conclusion”, which states:
For any world with a large number of happy people, there exists a better world with an arbitrarily large number of people in agony, as long as that agony is accompanied by a sufficiently larger number of people whose lives are barely worth living.
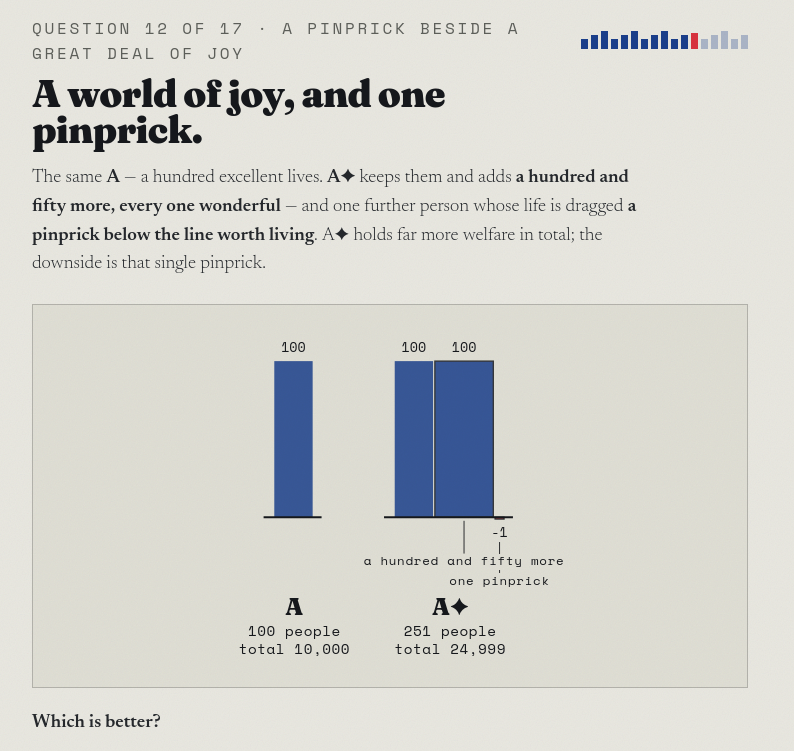
Then, if you answer the first question by saying A is better than H, the quiz asks you a third question:
How people answered the new questions
The new questions are only asked of people who accept the repugnant conclusion, which 53 of the new respondents did. Among those 53, here’s how they answered:



Among those who accepted the repugnant conclusion, 70% accepted the very repugnant conclusion, and 26% rejected it. (The other 4% said they couldn’t be ranked.)
The numbers suggest that, among the whole sample of quiz-takers:
- 15% accept the total view
- 8% accept a negative-leaning view
- 77% fall into one of the other categories
I looked at the answers on the three new questions to distinguish between flavors of negative-leaning view. Among those who accepted the repugnant conclusion:
- 60% gave answers consistent with the total view.
- 17% gave answers consistent with a lexical negative view—they would not accept even a pinprick of suffering for a large amount of happiness.
The following views each had a small number of respondents—to be conservative about preserving anonymity, I won’t specify exact numbers.
- constant-factor negative-leaning view
- sub-linear aggregation of happiness
- at least one of the pairs cannot be ranked (this kind of response doesn’t directly map onto a named view)
The total view was much more popular than the others, but other than that, the numeric differences between categories were statistically insignificant.
A quick explanation of how to tease these views out of a respondent’s answers:
- Total view – They always answer that more net welfare is better.
- Lexical negative view – They always prefer the option with less suffering, even on the pinprick question.
- Constant-factor negative-leaning view – They prefer outcome A over outcome H on the first new question, but also accept the very repugnant conclusion. (Reminder: Outcome H adds 100 people at welfare level 100, plus 40 people at welfare level –40.)
- Sub-linear aggregation – They reject the very repugnant conclusion, but prefer H over A, or prefer the pinprick-outcome A✦ over A.
Did v2 quiz-takers answer differently on the pre-existing questions?
One possible concern is that the people who took v2 of the quiz might be demographically different than the people who took v1. Did they answer the questions differently?
The only highly significant difference was familiarity—people who took v2 were significantly more likely to already be familiar with population ethics (p < 0.001). The only question with p < 0.05 was “repeating the moves” (p = 0.03), but it’s hard to infer that this is a real difference—getting p = 0.03 on just one question could easily be random chance.
That doesn’t mean there are no differences. We saw last time that familiar and unfamiliar respondents did answer differently, so the fact that v2 had more familiar respondents means there should be real differences between v1 and v2 as a whole. But the sample does not have enough statistical power to reliably detect the differences that (probably) exist.
How this changes the results from v1
When I reported the results from last time, I wrote that 32% of respondents gave answers consistent with the total view, or close to it. The new questions from v2 show that, assuming the samples are comparable, 40% of those 32% would be better described as holding negative-leaning views.
Here’s how people’s responses were classified in v2:

Totalist answers clustered more strongly than negative-leaning answers
I took the 53 respondents who accepted the repugnant conclusion and divided them into totalism vs. negative-leaning based on how they answered the new questions.
The totalist group (32 responses) had stronger answer consistency across respondents. Of those 32, 26 (81%) exactly matched the total view across all the questions (not just the new ones). The other 6 responses included 5 distinct answer profiles, none of which exactly matched a catalogued view.
The negative-leaning group (21 responses) was much more diffuse—it included 17 distinct answer profiles. The most popular answer profile exactly matched lexical negative utilitarianism, but fewer than 5 people responded with that answer profile. Most of the 21 responses did not exactly match any catalogued view.
This finding is qualitatively consistent with v1: last time, when I looked at clusters of answers, totalists clustered much more tightly than anyone else.
Note on the thumbnail image: I meant to search for a picture of a crowd, but I accidentally typed “crows” and decided to roll with it. Photo by Annie B Paul.
Notes
-
The previous post claimed there are four flavors of negative-leaning view, not three. Two of the flavors—lexical negative utilitarianism and maximally negative utilitarianism—cannot be distinguished by the new questions, so I collapsed them into one view for the purposes of the current post. The two views are distinguished by some of the v1 questions. Namely, if a question compares two outcomes where the second adds strictly more happiness, then a lexical view prefers the greater happiness, while a maximally negative view is indifferent. ↩